I do not have a strong sense of what I’m doing when it comes to investing in stocks, but I’ve dabbled in the subject, find it interesting, and loosely follow what’s happening to the market. I focus on the S&P 500 while occasionally looking at a specific stock. While I would never advise someone to follow my perspective on the market, I figured I would document my thoughts right now so that I can look back on them in 6-12 months to see how correct my thinking was.
Back in November/December I mentioned to a colleague at work that I thought the market had bottomed. This perspective was based on the information-sphere (internet, media, news, etc.) being over-saturated with negative market outlooks. When I begin to see certain types of doom-titled articles about the market, in the past I’ve found that those moments mark the bottom of the downtrend. There’s no one left to sell and that’s when the buyers resume control of the market. So far my prediction from last year has turned out to be correct.
The S&P has been in an intermediate uptrend since October last year. Indicators have generally been positive and just this week price bounced off the 50 day moving average. People in general still seem quite pessimistic about financial conditions though. I don’t have high hopes of this uptrend extending significantly further in the near future. It will likely take more time for financial attitudes to lighten enough for the market to grow.
While looking at the weekly chart above is interesting, things get even more interesting when looking at the weekly chart for the S&P:
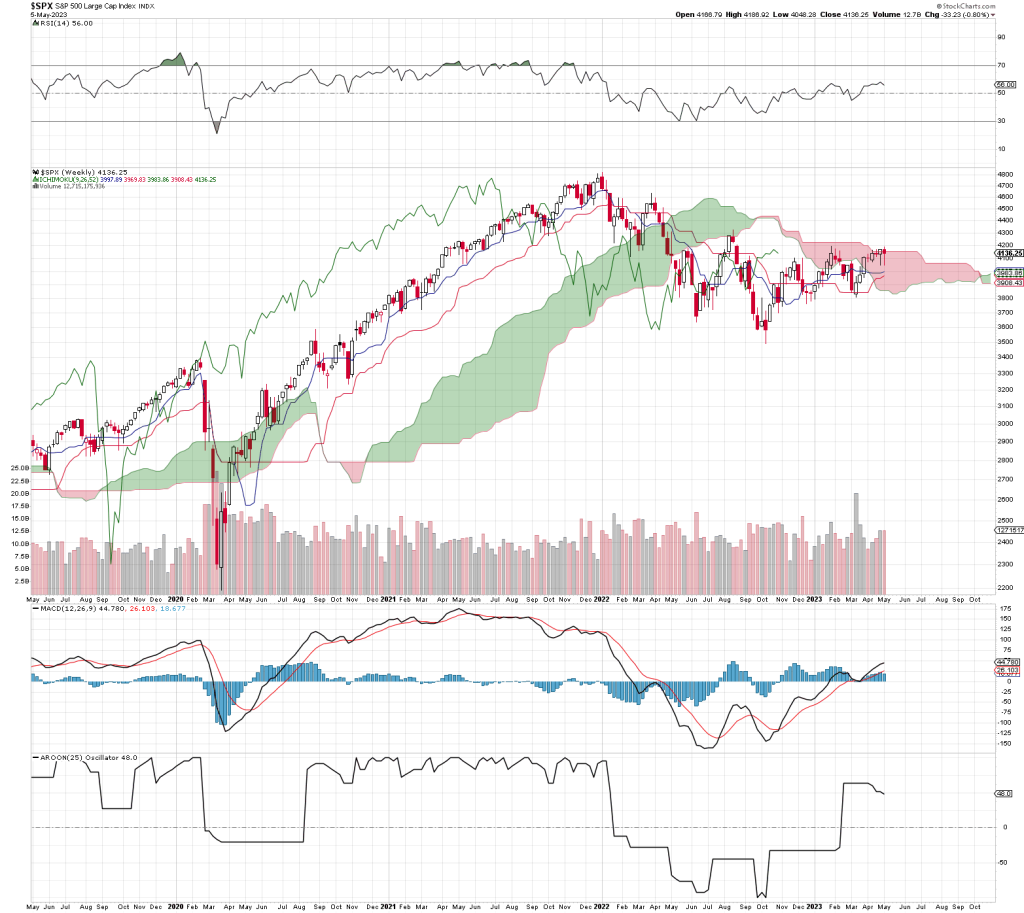
The rosiness of the daily bar chart disappears to some degree when looking at the weekly chart. Price action has been struggling to break above a cloud since the beginning of the year and there’s clearly strong resistance at 4200. However, price action keeps testing that resistance. If it keeps doing what it’s doing now, eventually the price will breakout higher with the next significant resistance being at 4600 and 4200 becoming support. I am optimistic that we will see that happen by late summer, barring any major catastrophic world events.
So that’s the basic summary of what I see when I look at the stock market right now. Just to provide some background, I thought I’d elaborate a bit about the tools I used to stay informed and follow the market:
I do not follow any specific sources of news to inform my investing perspective. I absorb what makes its way to me through Reddit, YouTube, and a couple news email newsletters. For the most part, my investing follows the technical analysis approach which dictates that all of the information I need to know about a stock is represented in it’s price action. It is impossible for me as an amateur, hobbyist, individual investor to know more than what the market already knows. The only way for me to make money is to ride the trends and waves of the market. Given these circumstances, I believe in following the price action of the market and that’s why following price action is the only research I do.
I use a great service called StockCharts.com. It’s a super powerful set of tools that can do much more than I need to do. The service provides excellent charting features and even a mobile app to view my charts on-the-go. I have not found a better way to view detailed, customized bar charts. I don’t think I would want anything to do with investing if StockCharts.com did not exist. I definitely recommend giving it a try.