There are two weather-related items I want to share with you today: Dark Sky and Weather West
Dark Sky
When it comes to weather apps, there are a million of them. Some are simple, some are complex, but regardless of what they look like almost all of them represent the same underlying data. That data comes from the National Weather Service (NWS), part of the National Oceanic and Atmospheric Administration (NOAA). However, there is a weather forecasting service called Dark Sky that is different from other weather apps.
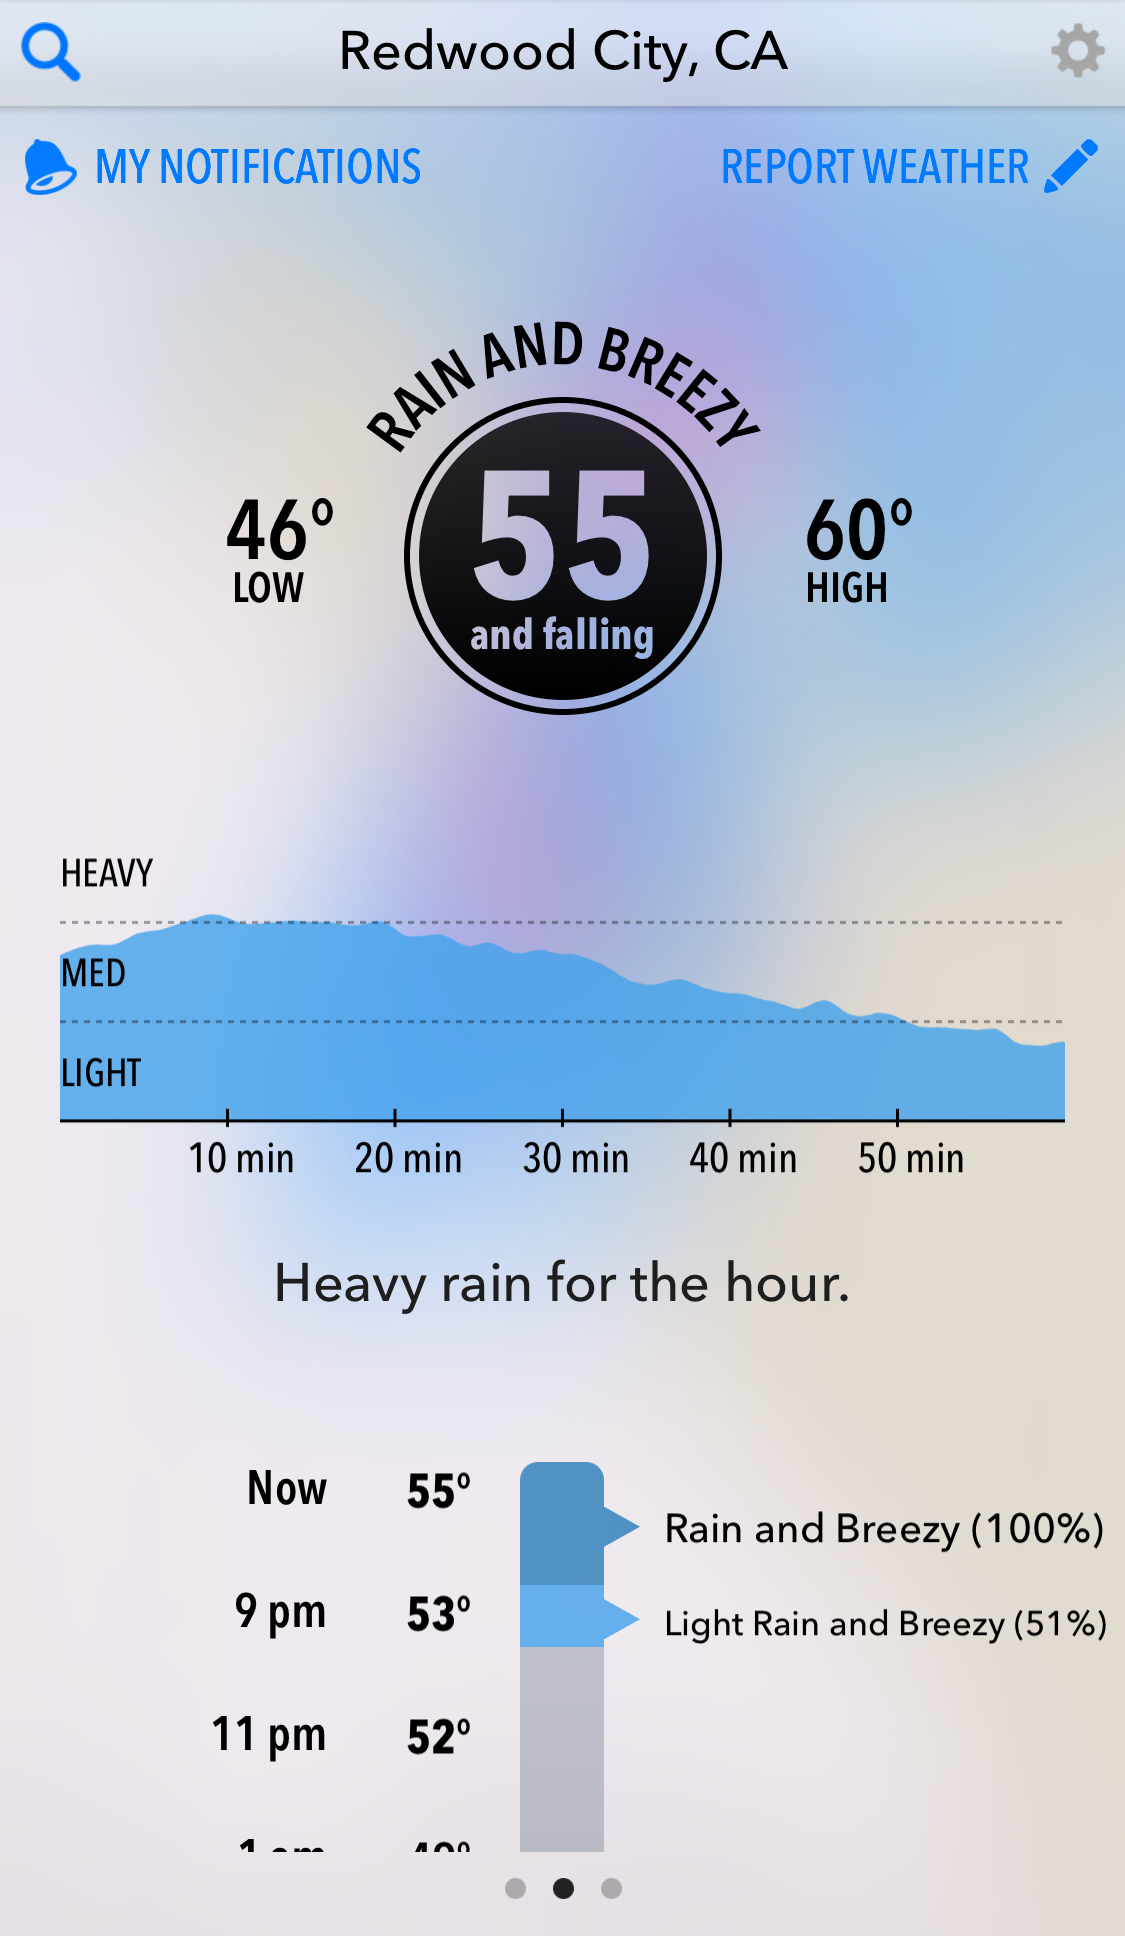
Dark Sky’s primary function is providing hyperlocal weather forecasts. Specifically, Dark Sky can provide precipitation forecasts which are accurate down to the minute-level. While Dark Sky is still using the same NWS weather data that other apps use, Dark Sky does more. They pull in NWS data, process it, clean it, and then use the results to build extraordinarily fluid precipitation maps like the one below. There’s a detailed post on the Dark Sky blog if you’d like to read more about how Dark Sky works.

The forecasts that Dark Sky produces are so detailed and accurate that many other weather apps use Dark Sky’s API to obtain weather forecasts instead of using NWS data. Sun, Weather Line, and Poncho are three app examples and other users include Yelp, Microsoft, Con Edison, and DuckDuckGo.
Dark Sky started life in 2011 as a weather app for iPhone. In fact, Dark Sky came to life with a successful Kickstarter campaign that raised about $39,000, which is how I became familiar with the service. Since then, Dark Sky has grown to include an app for Android as well as a full website.
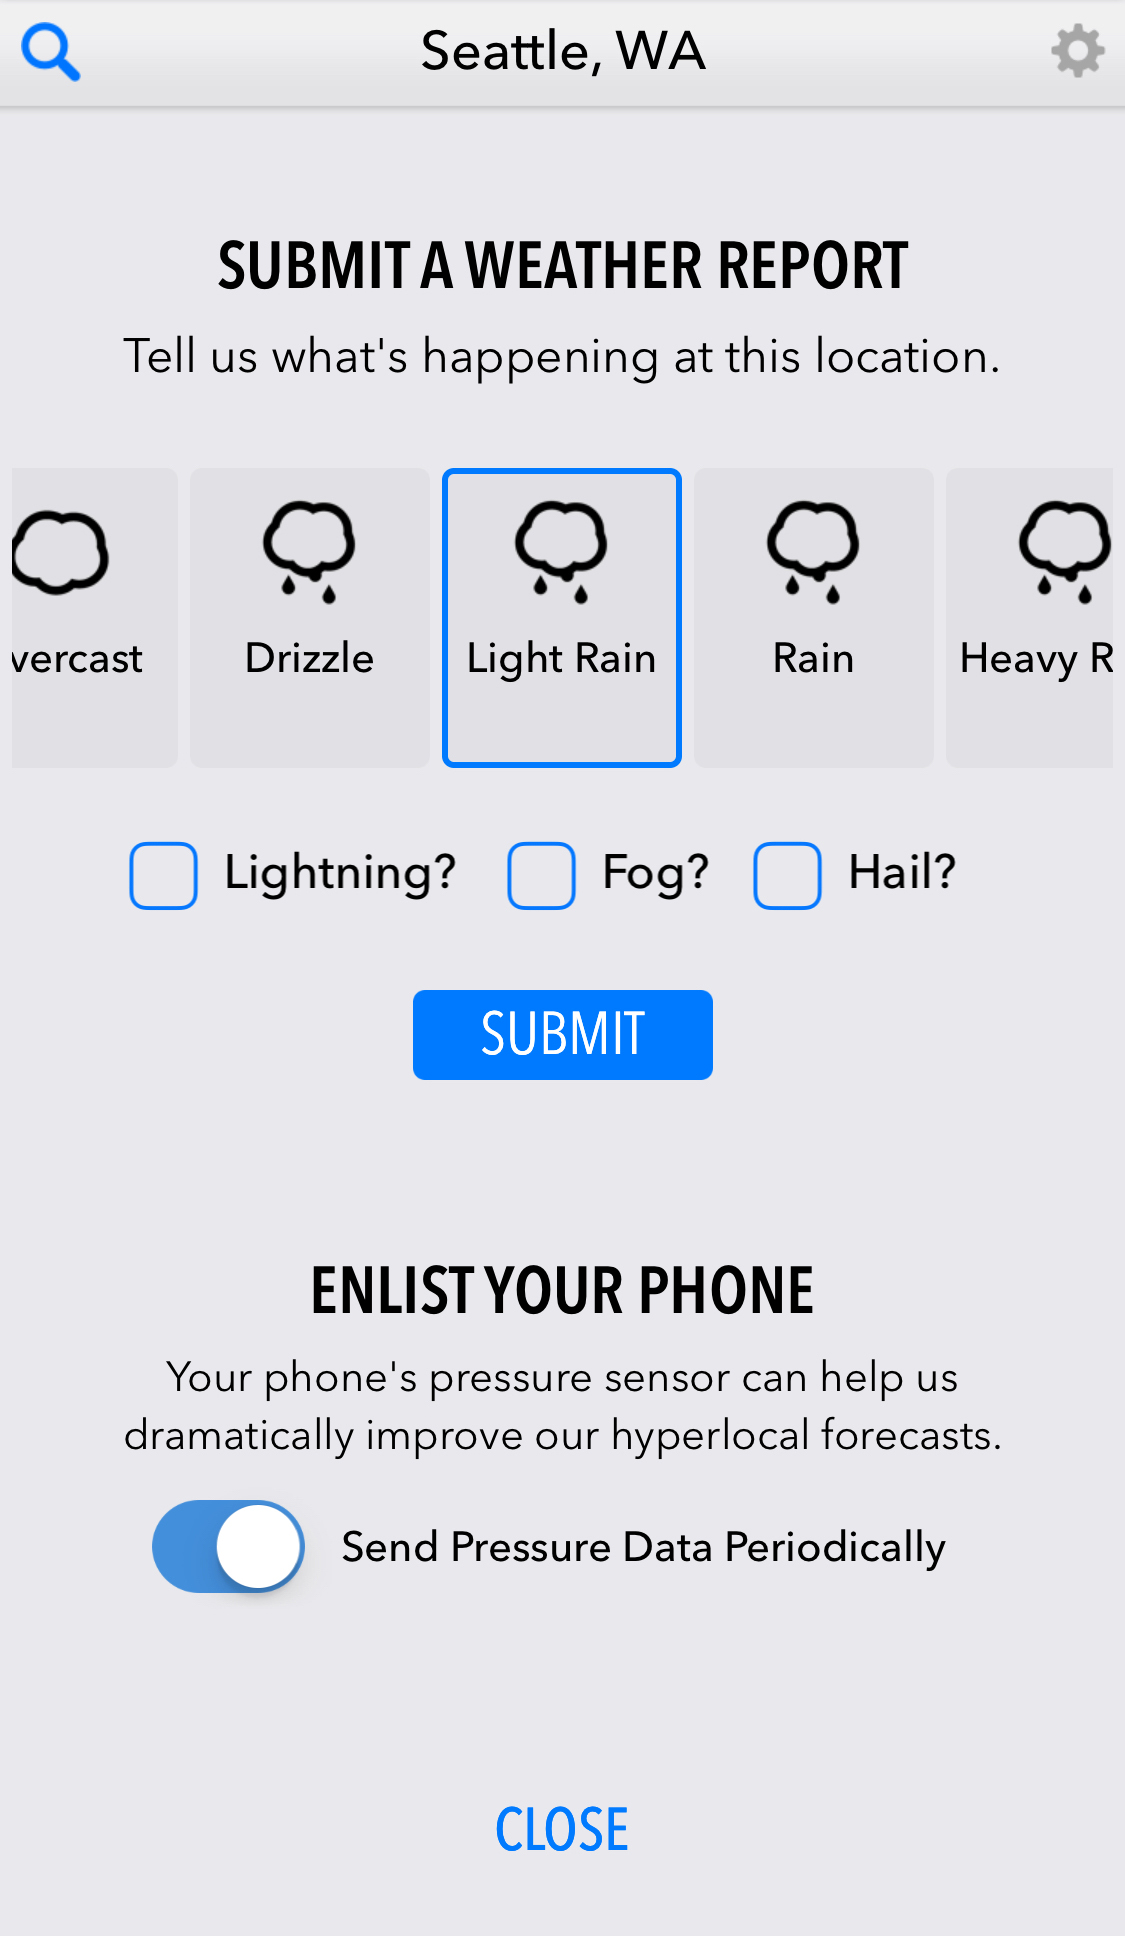
One reason Dark Sky is able to provide accurate forecasts at the hyperlocal level is because of the reporting features that exist within the Dark Sky app. With a user’s permission, the app can periodically measure and report the barometric pressure sensed by their phone. Users can also manually report the current weather at their location. As Dark Sky collects this data, they are able to refine their forecasting system to produce more accuracy.
While Dark Sky is known for its precipitation forecasts, a lesser known yet particularly stunning section of the service is Dark Sky Maps. Dark Sky Maps provides a Google Maps-like view of Earth with different data layers overlaid. Temperature, cloud cover, precipitation, wind, dew point, UV exposure, atmospheric pressure, and ozone are all covered by layers in Dark Sky Maps. There’s even an emoji layer which fills the map with adorable little icons.
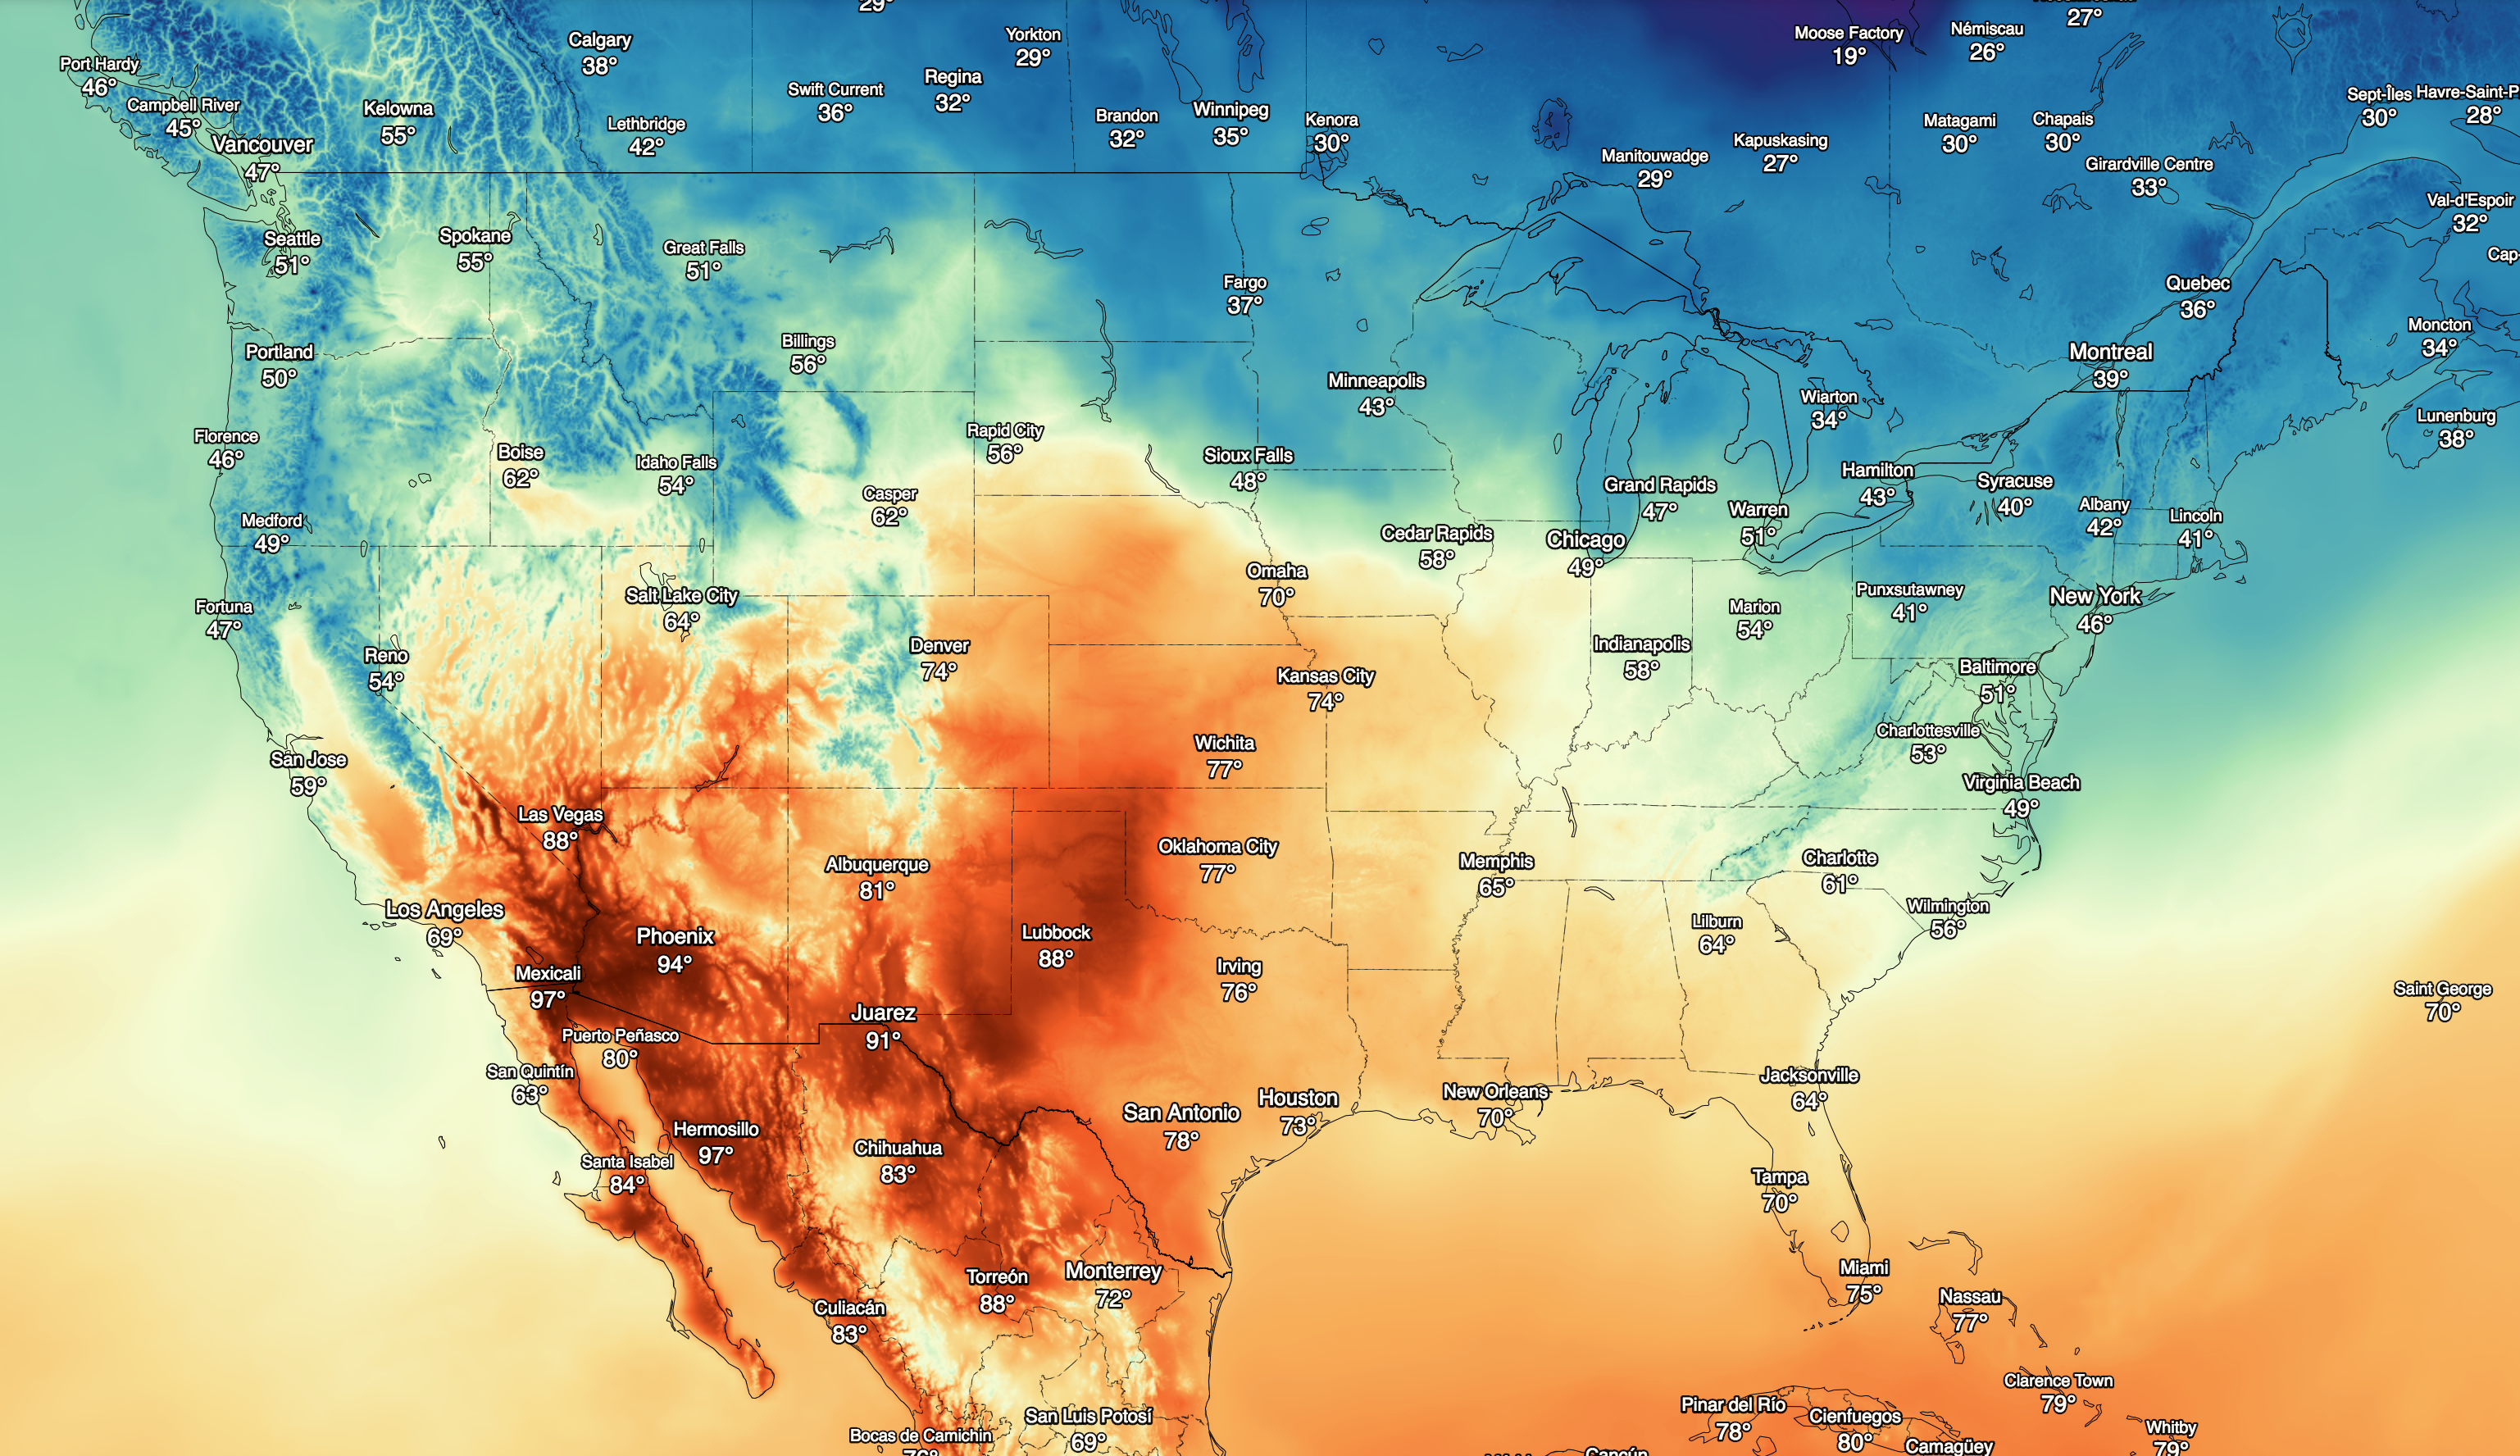
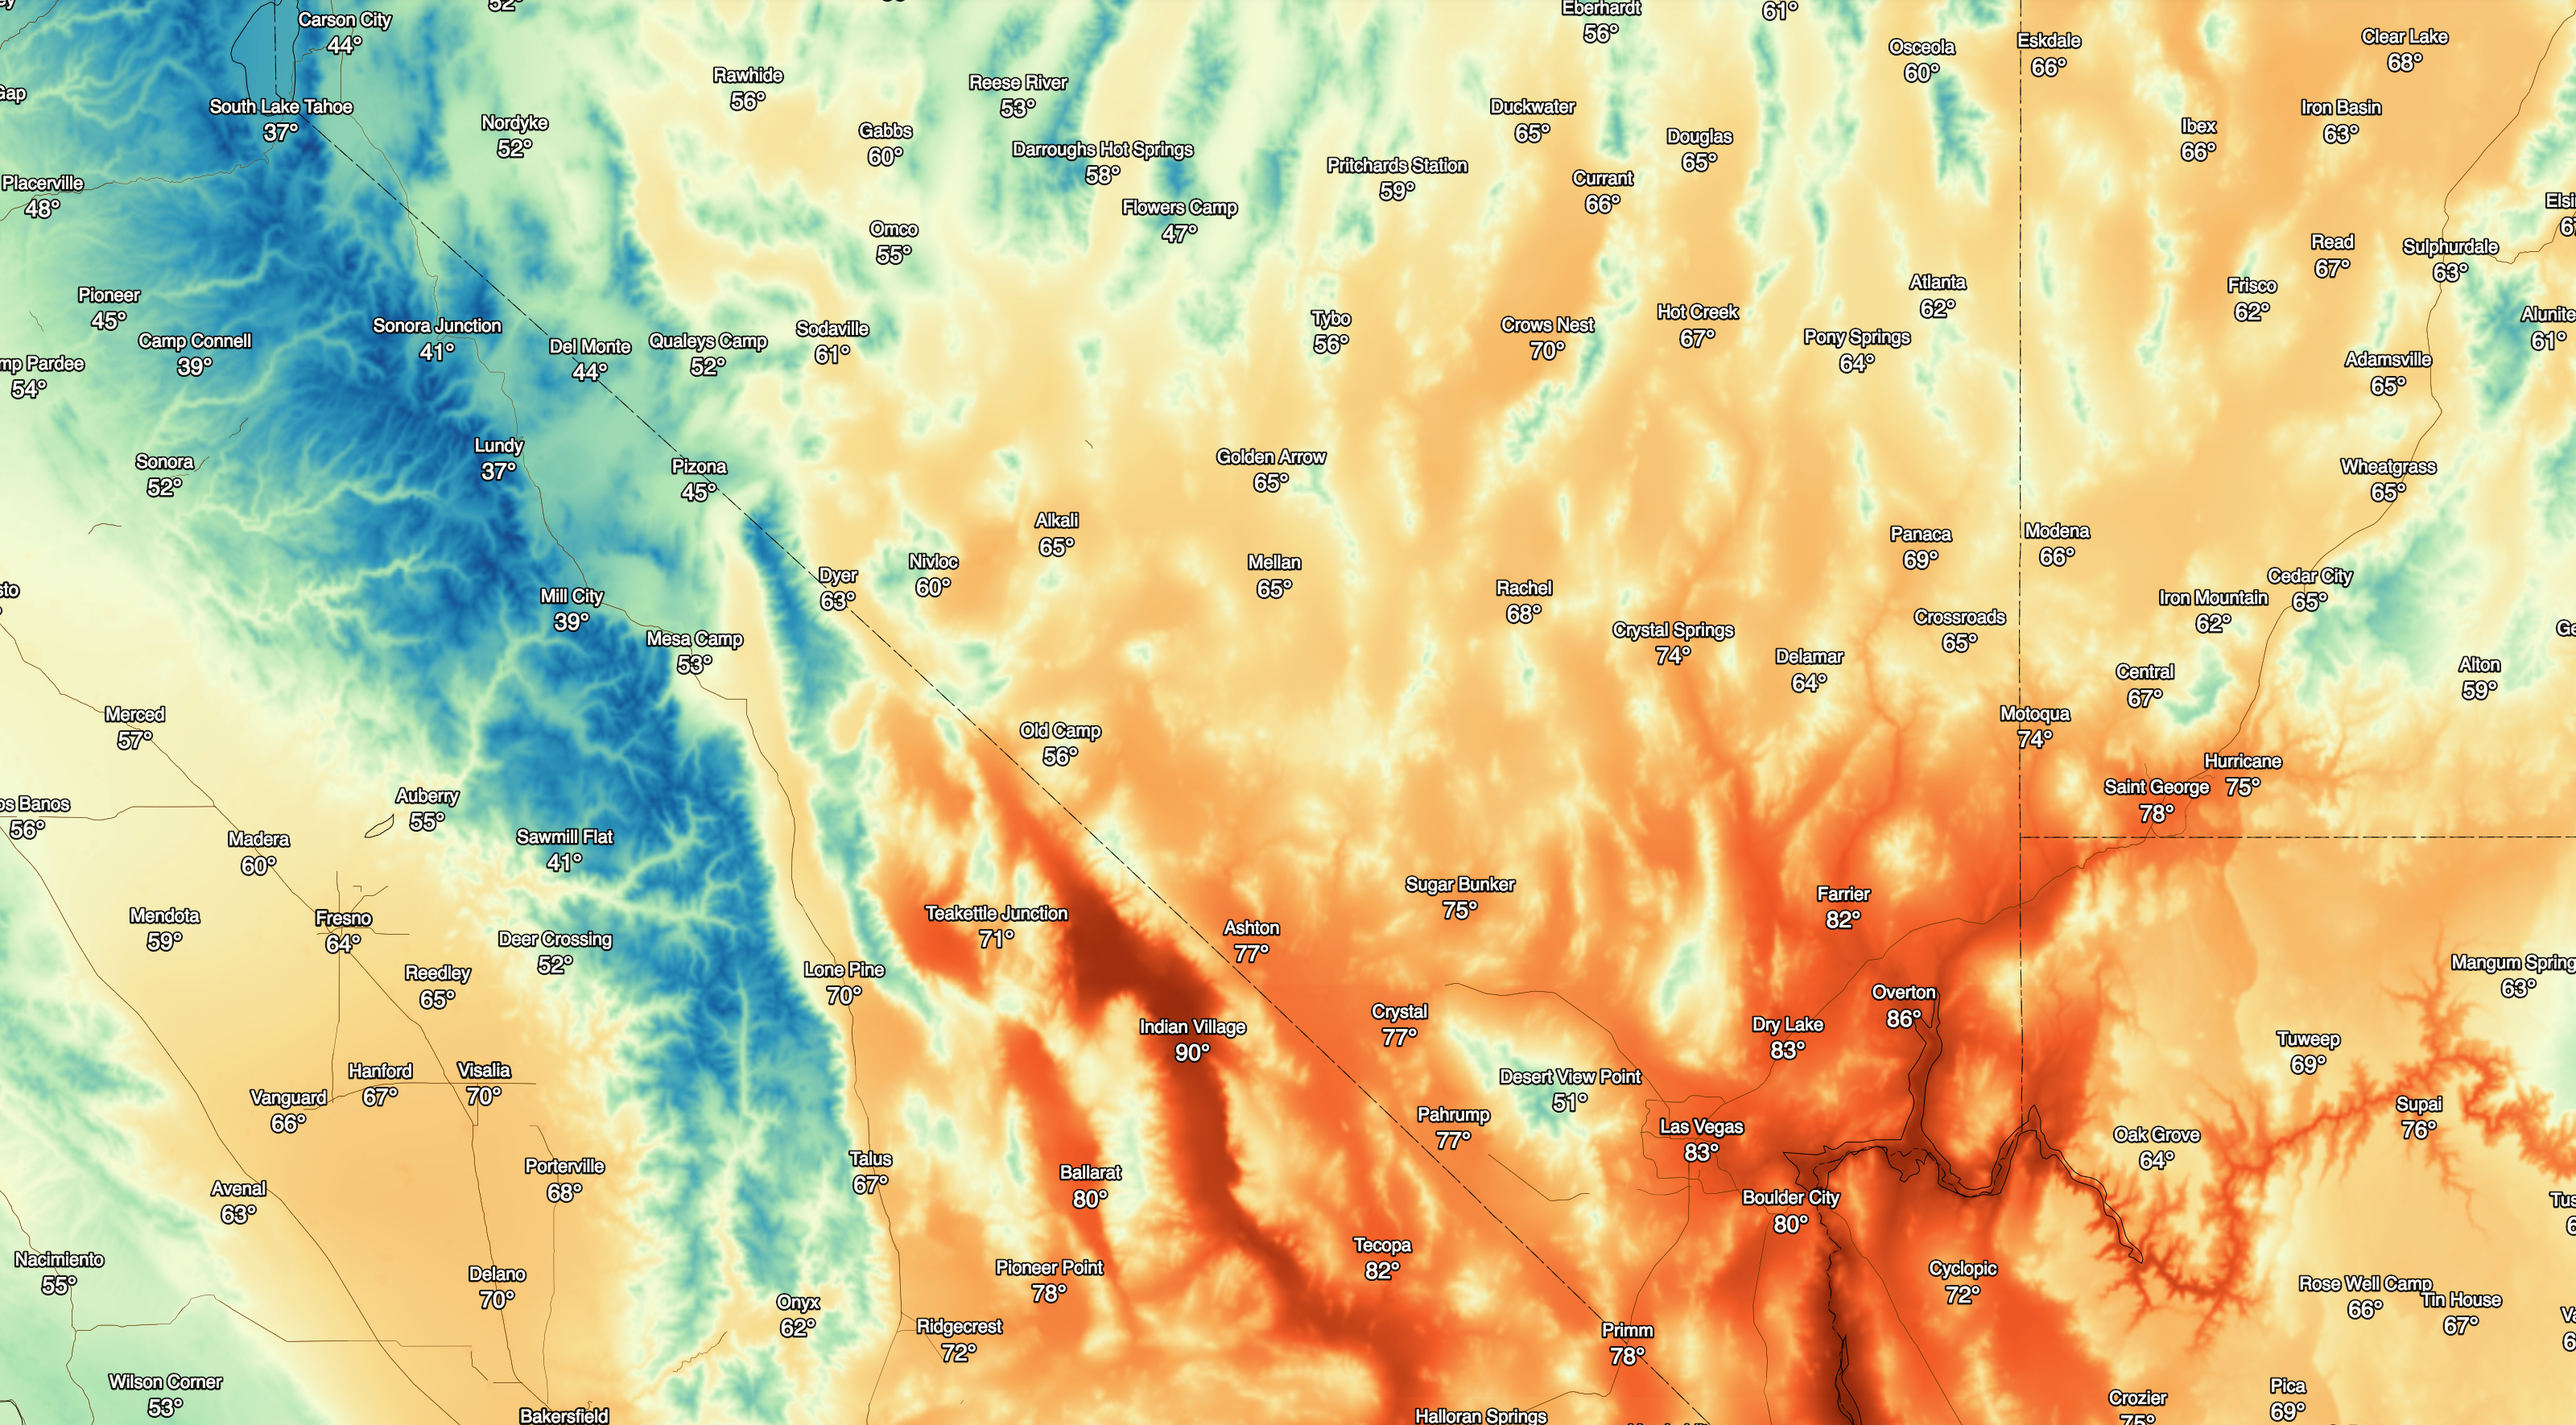
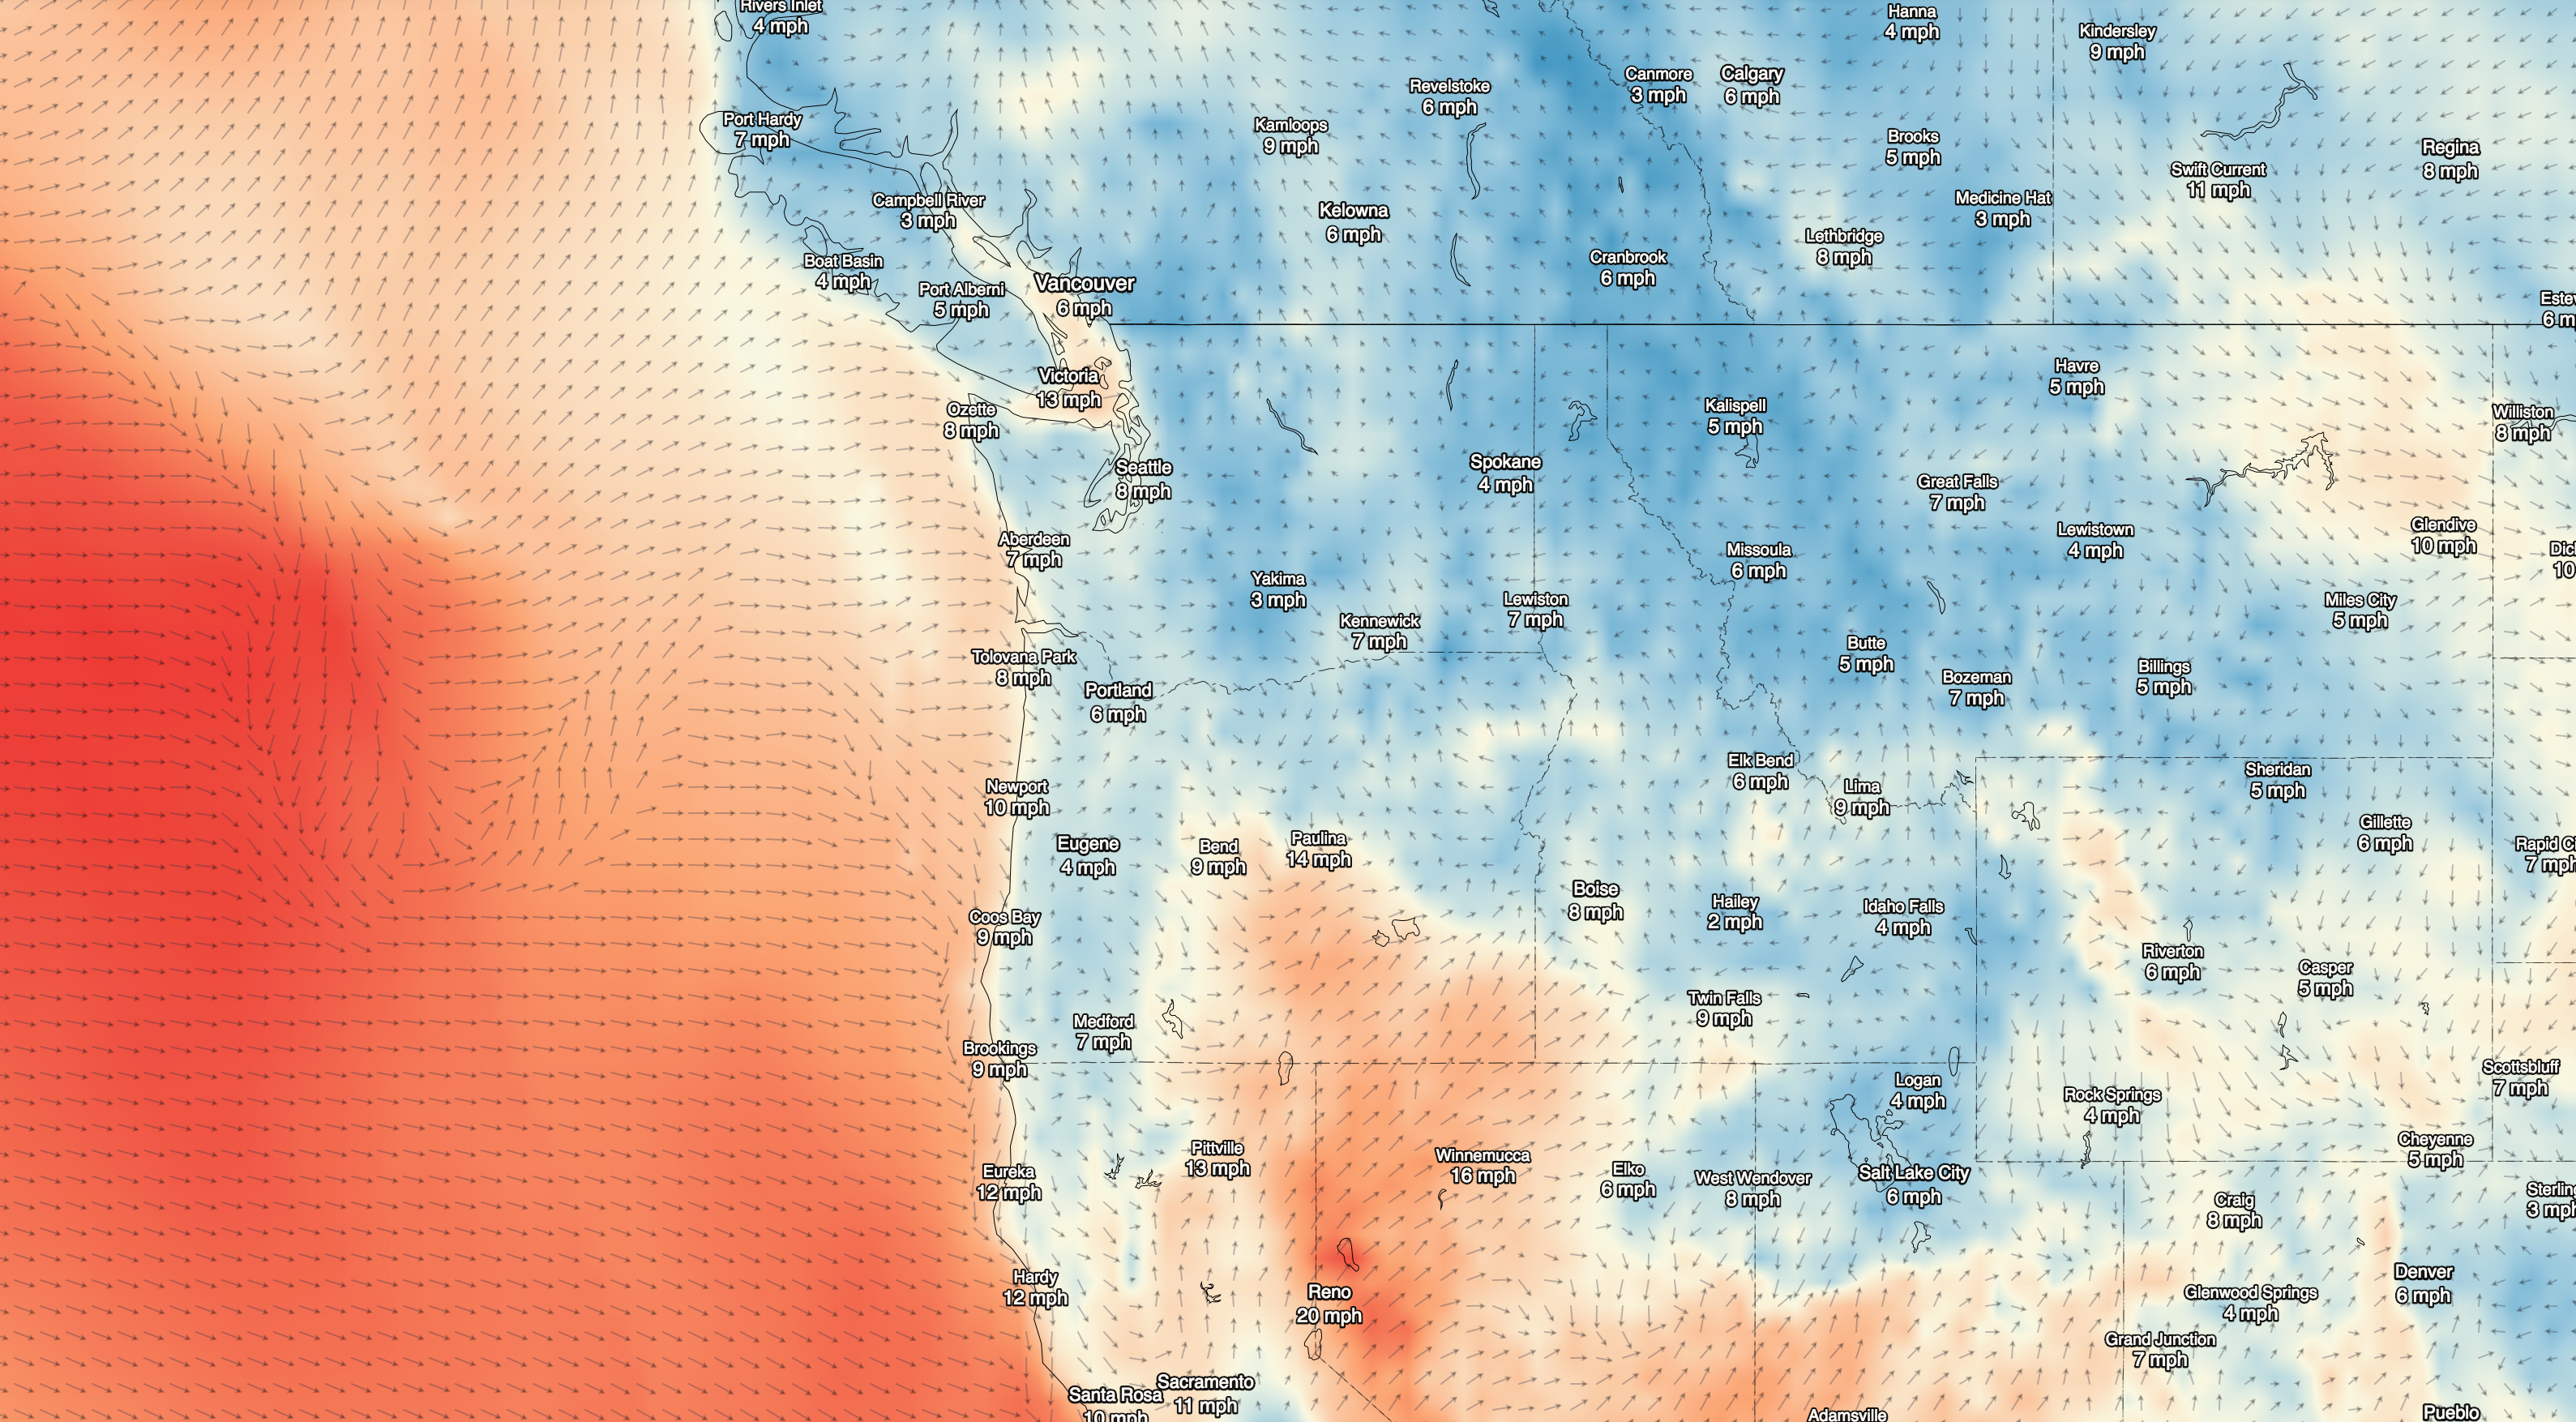
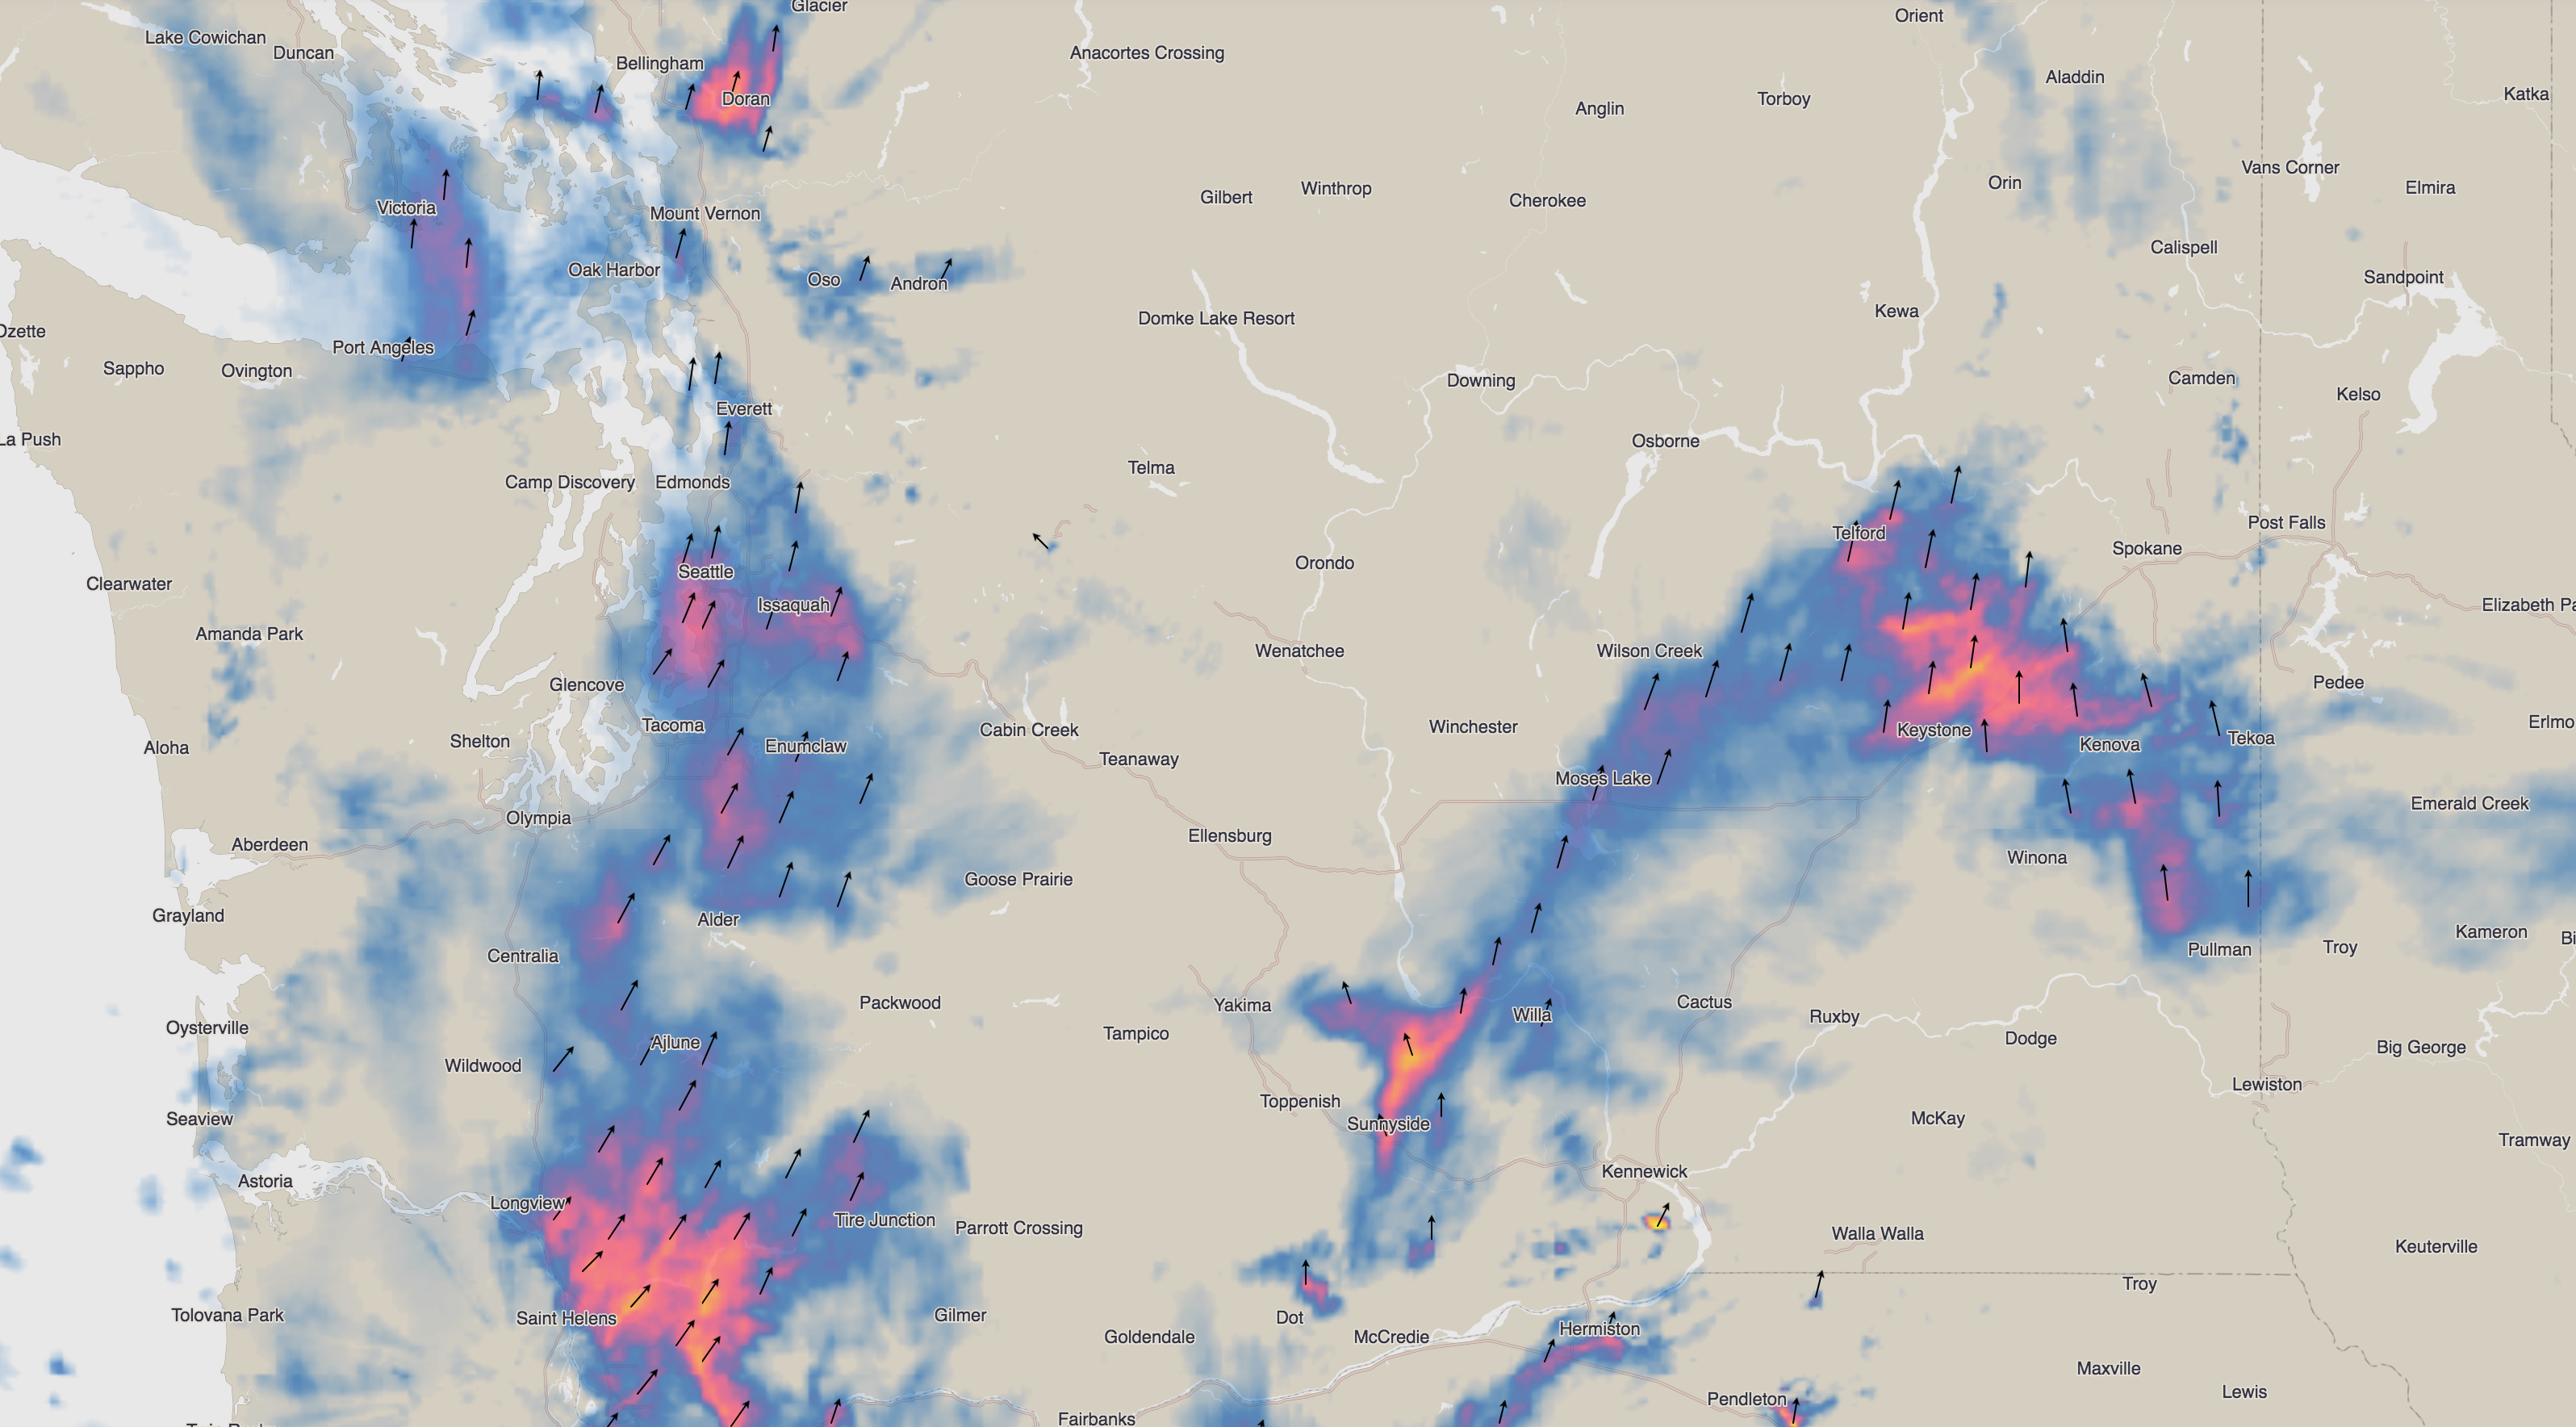
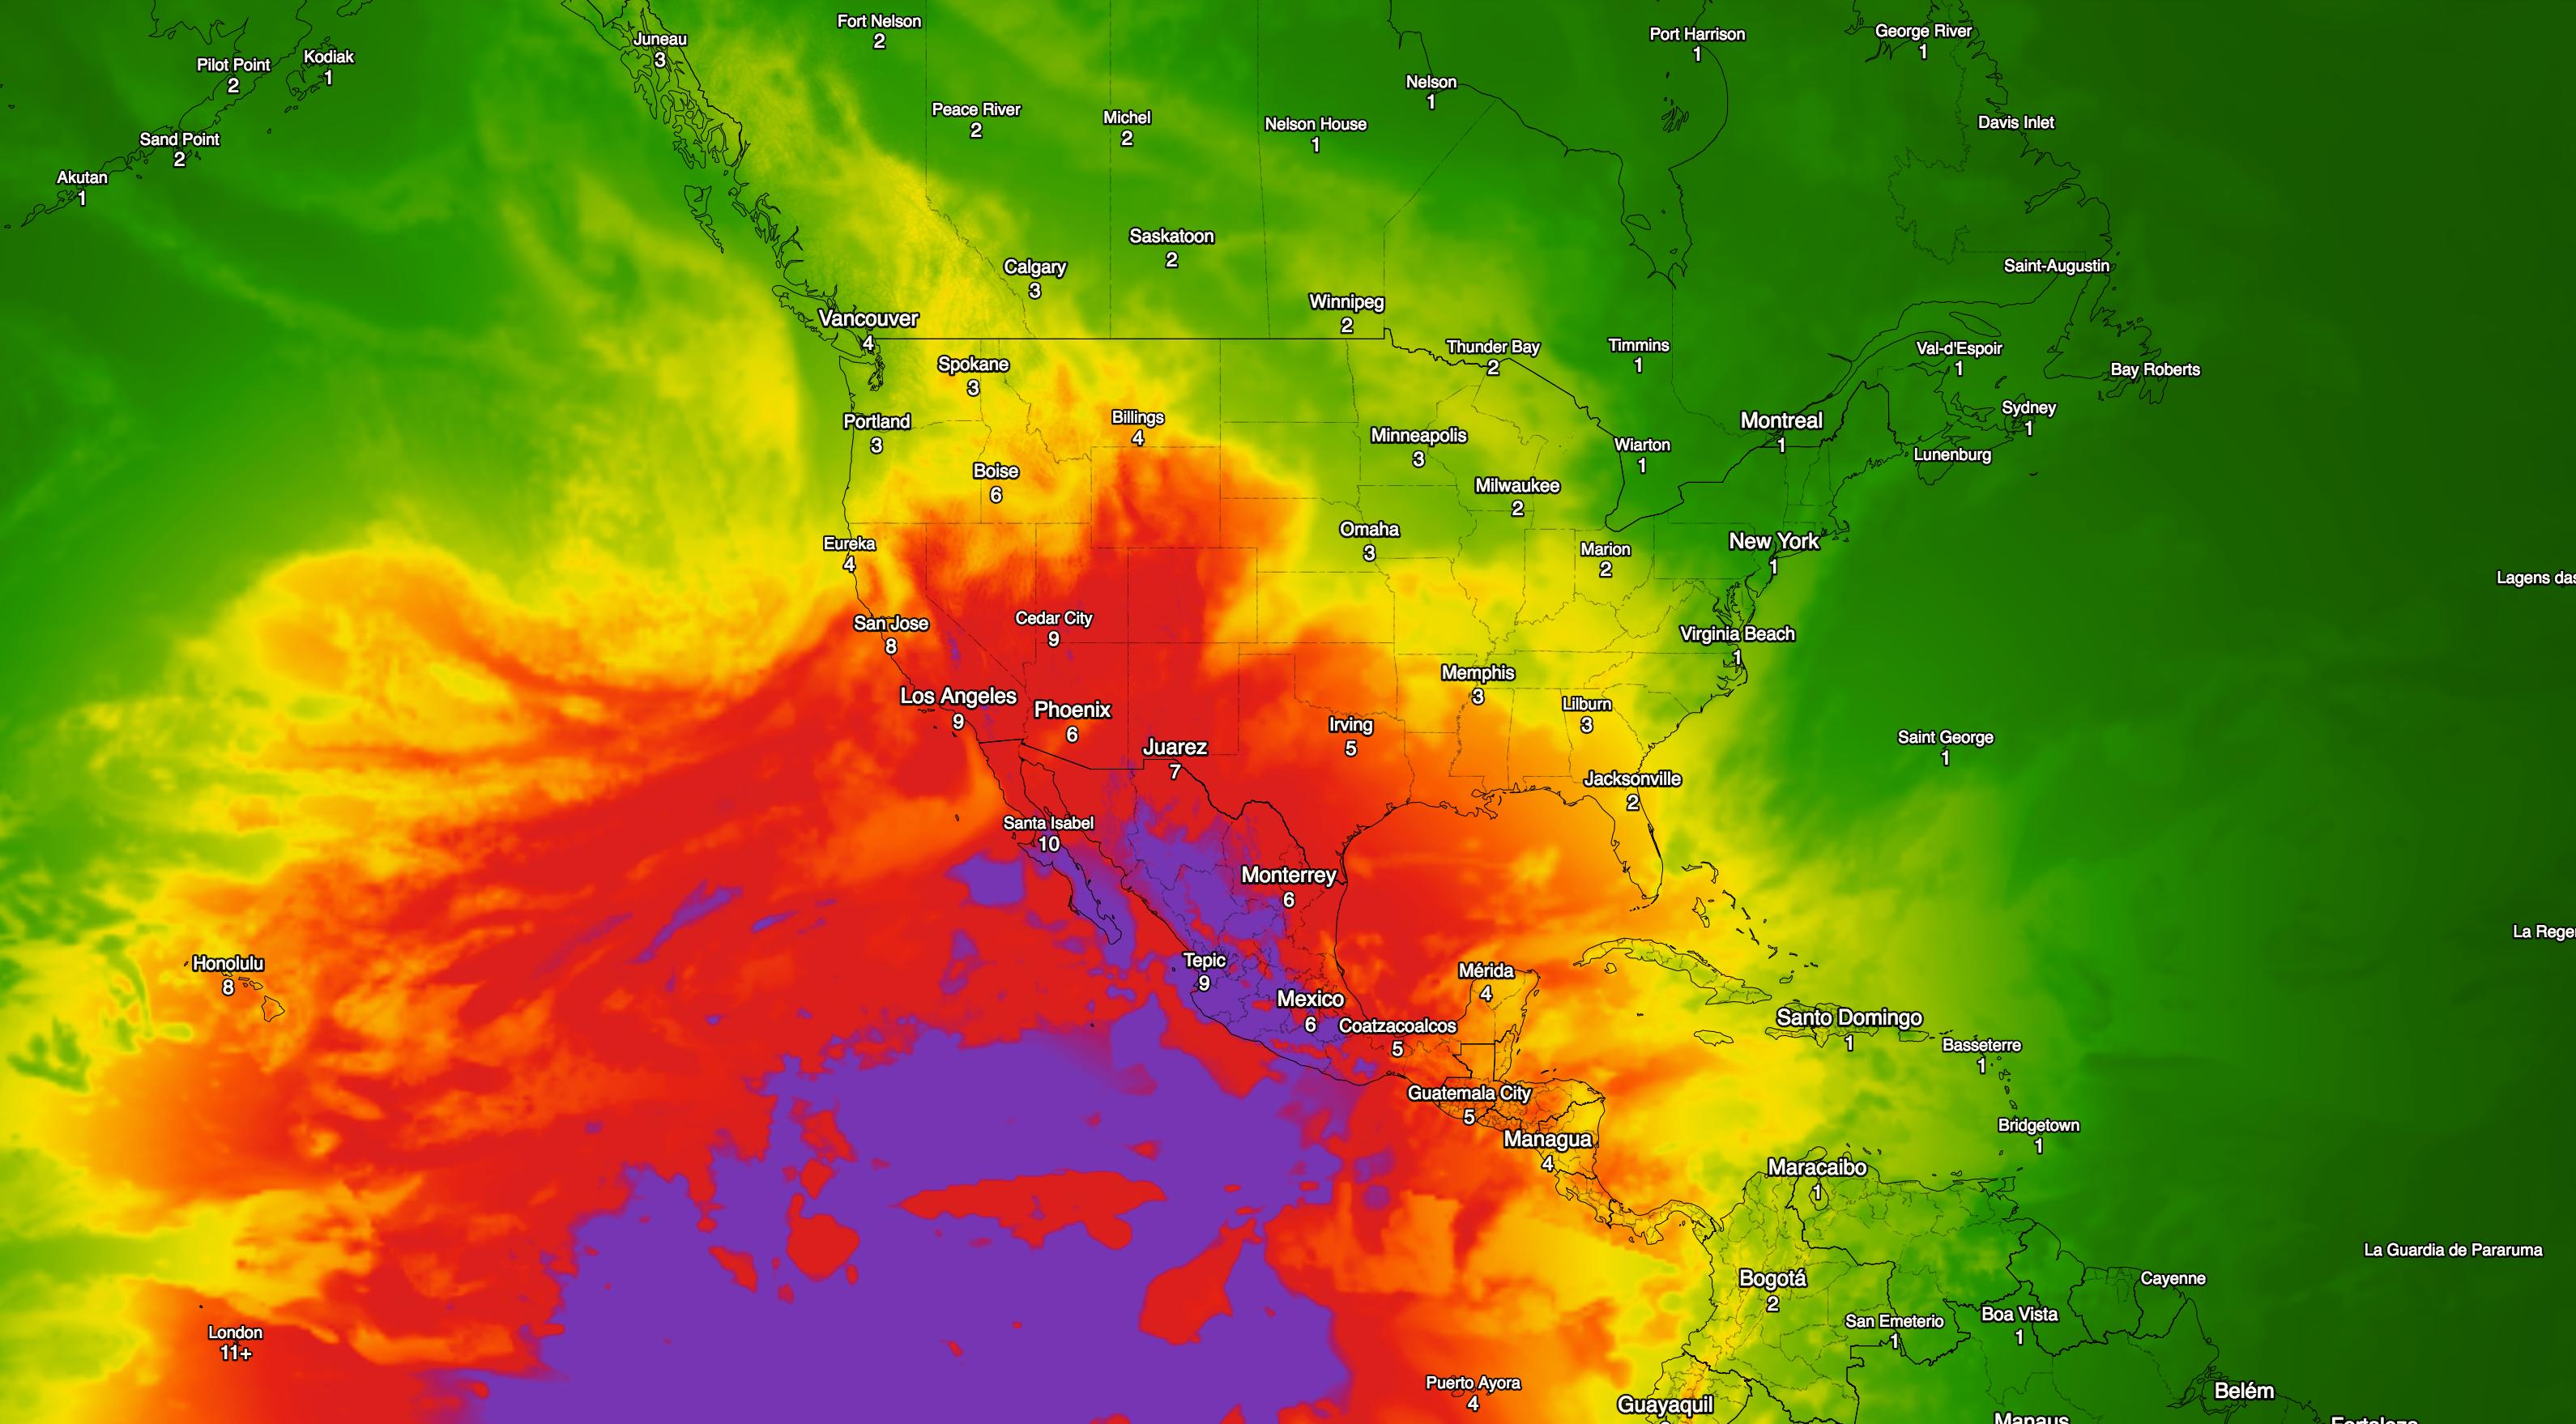
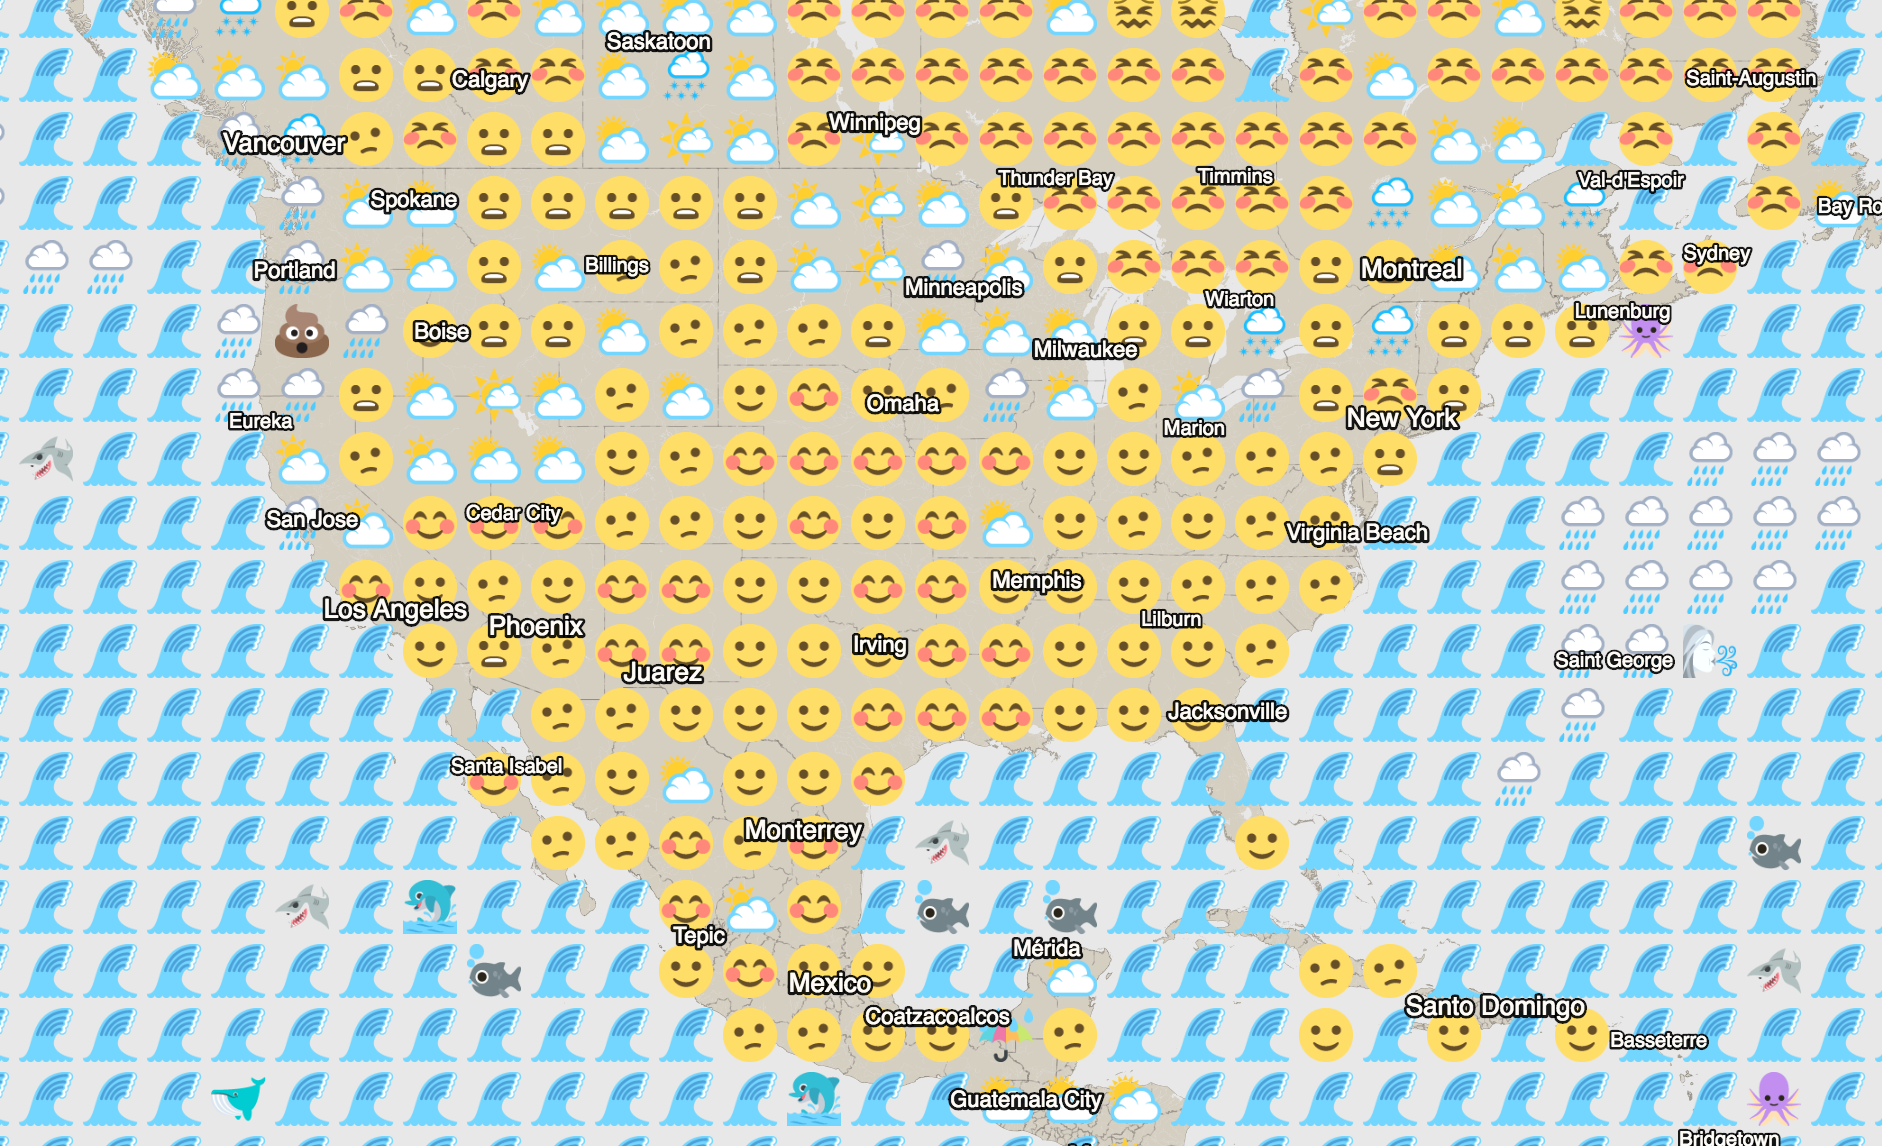
Any of these maps can be embedded in a website too. Try interacting with the map below:
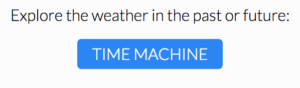
There’s even a “time machine” feature on the Dark Sky website which lets you view the weather conditions for specific dates in history, such as the day you were born. I don’t know how far their data goes back, but when I punch in the year 1950 I’m still able to see weather data.
I cannot recommend Dark Sky highly enough. While it’s not perfect for absolutely every use case, snow and surf reports come to mind, I have been a daily user of Dark Sky for many years and it has served me extremely well.
Weather West
When I need to know what the weather forecast is, I open up Dark Sky. When I want to know why the weather is going to behave as it is predicted, I open up Weather West.
Weather West is the online name of Dr. Daniel Swain. He is best introduced using the words from his own About page at WeatherWest.com:
Dr. Daniel Swain is currently a NatureNet Postdoctoral Fellow in the Institute of the Environment and Sustainability at the University of California, Los Angeles. As a climate scientist, he studies the changing character and causes of extreme meteorological events. Daniel holds a PhD in Earth System Science from Stanford University and a B.S. in Atmospheric Science from the University of California, Davis. His full curriculum vitae is available here.
The California Weather Blog is where Dr. Swain posts 2-3 times per month with his perspective on the current weather affecting California. While he does use complicated words such as orographic, isothermal, and prodigious, Dr. Swain’s posts are actually quite comprehensible. It is fascinating to gain an understanding of the current California weather and climate from his perspective. If our climate is a machine, Dr. Swain can point out the individual gears and explain what they are doing. The breadth and depth of Dr. Swain’s understanding of the weather allows him to turn what is usually a dry subject into something engaging.
Dr. Swain’s study of California’s climate has been influential, even outside of the world of climate scientists. If you’ve heard anything about California’s Winter weather over the past 5 years, chances are that you’ve heard something about the Ridiculously Resilient Ridge (RRR). That’s a term coined by Dr. Swain which is now widely used.
If California weather affects you in any way, or if you simply share a curiosity about the weather and climate in general, I definitely recommend subscribing to The California Weather Blog.